

In the last 20 years, a fair amount has been said about “big data” and how to approach it; however, what to honestly do with it and how to make it actionable is somewhat unclear. It follows a high-level – and transparent – roadmap on treating your data and making it work for you.
There are five stages in turning data into actions:
1 – Identify where your data is and comes from
- APIs, web server logs, transaction DB, POS, eCommerce system, etc.
2 – Extract it and save it into your data lake as raw data (more on “Why Data Lakes and not Data Warehouses in a different post)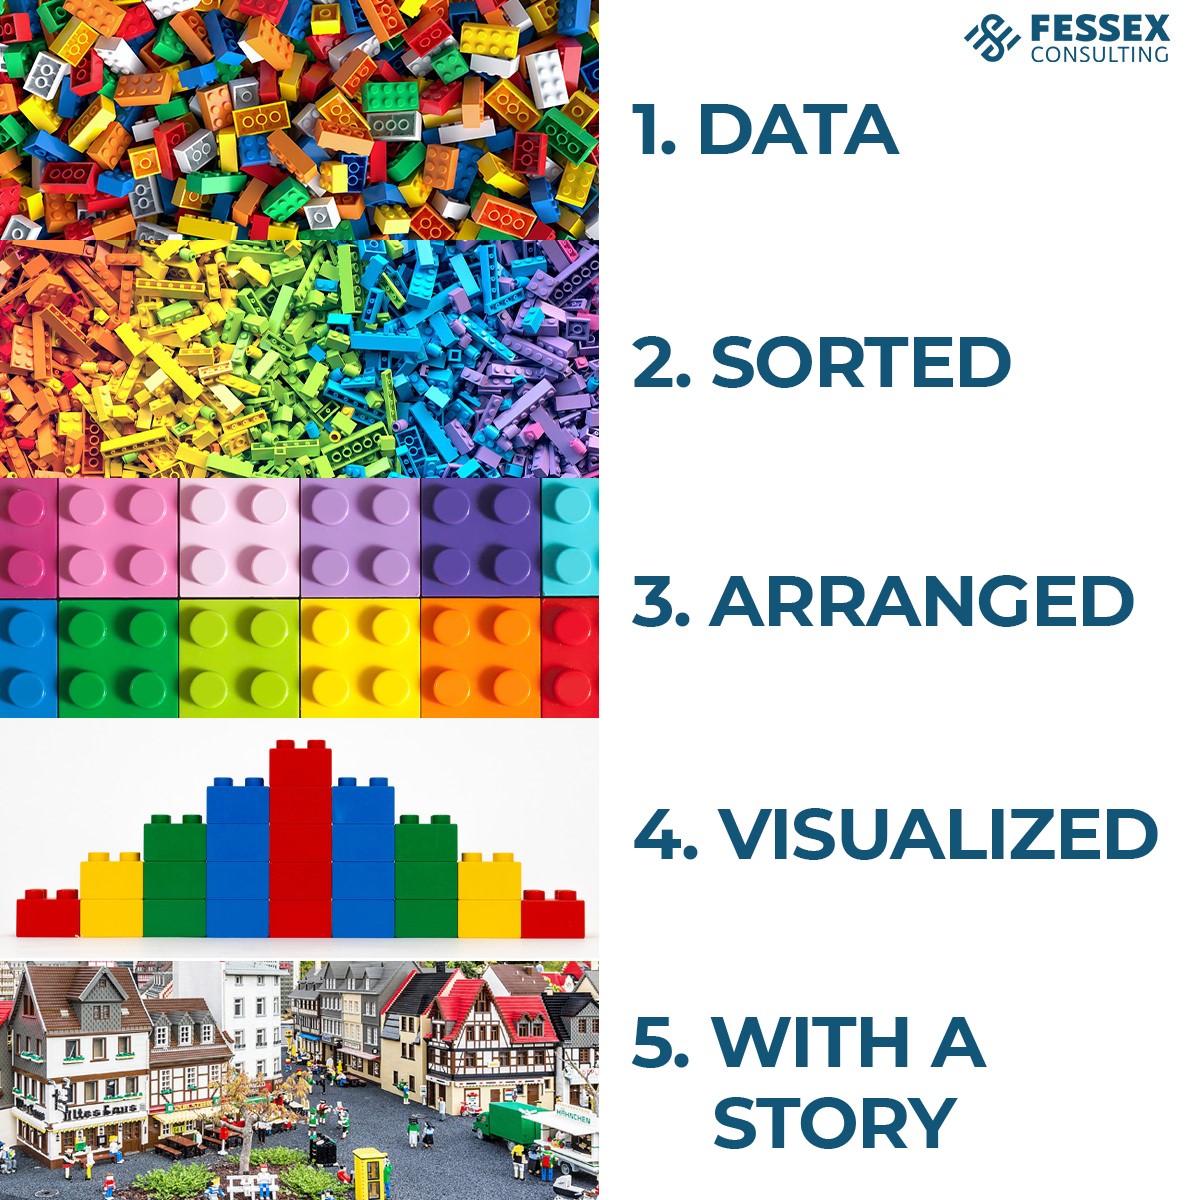
- S3, Cassandra, Snowflake, Dynamo, CloudFormation, etc.
- JSON, CSVs, Parquet, etc.
3 – Organize needed data into a cleansed (curated) layer that is easy to manipulate and integrate onto other systems
- Postgres/RedShift, MySQL, SQLServer, etc.
- Marketing Automation, ESPs, etc.
4 – Visualize your data by creating a dashboard and reports
- Sigma, Looker, PowerBI, Tableau, etc.
5 – Create a hypothesis and run experiments
- Churn, Conversion, pLTV, Cluster Analysis, etc.
Your organization may be at any one of these stages. However, your company will get the highest impact out of stage 5.
Let’s dive into each one of these stages:
1 – Identify where your data is and comes from
You have data already, whether you know it or not. Moreover, you are collecting data too. Your data may be buried in server logs or transaction databases in your web analytics platform, POS system, etc. It exists in copious amounts; you need to get it out onto a system where your data can be cataloged and organized.
2 – Extract your data and save it into your data lake
Now that you know where your data is, you need to save it into a data lake. Data lakes enable you to save ALL your data and not choose what to keep – storage is inexpensive. It will help you accelerate answering questions. You can use various technologies and formats to build a Data Lake and store your data. The most important part of a data lake is creating a catalog. You need to know what is in there.
3 – Extract needed data into a cleansed layer that is easy to manipulate
Your data in the data lake should be in raw format; it needs to be extracted and cleansed. Only extract what you need when you need it. The cleansed (or results database) is a separate database where you can run queries and start to answer questions:
- How many active users do you have?
- How much revenue have we had in the last 24 hours (week, month, etc.)?
- Where do my consumers spend more time?
- What marketing channels are more profitable
- What products sell more?
- Etc.
4 – Visualize your data by creating a dashboard and reports
You will want to automate answering the questions above and many others. In other words, you want those questions to be answered continuously. The best way to do just that is to deploy using best-in-class visualization tools and visualize your answers in the form of dashboards. Ultimately, you want your entire organization to have access to most of the solutions; it will enable you to operate more efficiently by having everyone aligned. It also helps you communicate the organization’s business goals and their drivers in no uncertain terms.
5 – Create a hypothesis and run experiments
Now that you have your data, data lake, cleansed layer, and dashboards, it is time to turn your data into actions. We do that by:
- You are exploring your data and running an analysis on it.
- Developing hypotheses and validating them with you and the data
- We design experiments and execute them to prove or disprove your hypothesis
- Results of the experiments are displayed in the dashboards where they are analyzed
- Based on the results, we reworked the hypothesis and reran the experiment.
- We keep on repeating this process.
There are a few elements to note:
- If the hypothesis is proven correct, then you expand the experiment. The initial experiment will be small and low-budgeted. You increase the size and budget as it continues to prove right.
- If the hypothesis is proven incorrect, the experiment was also successful because now you know what “not to do.” Also, you need to revise your hypothesis and try again.
- Hypotheses are created based on data science and machine learning models that predict future behaviors such as churn, conversion, LTV, product affinity, etc.
- Success is achieved iteratively.
So what stage are you at in the data journey? Have you taken a similar path or has this post started you on a journey? Let us know below and feel free to ask questions!
- The Data Journey: 5 Stages Of Turning Data Into Actions - May 13, 2022